A Measurement Study of Peer-to-Peer File Sharing Systems
|
Stefan Saroiu |
P. Krishna Gummadi |
Steven D. Gribble |
|
Department of Computer Science & Engineering {tzoompy, gummadi, gribble}@cs.washington.edu |
||
ABSTRACT
The popularity of peer-to-peer multimedia file sharing applications such as Gnutella and Napster has created a flurry of recent research activity into peer-to-peer architectures. We believe that the proper evaluation of a peer-to-peer system must take into account the characteristics of the peers that choose to participate. Surprisingly, however, few of the peer-to-peer architectures currently being developed are evaluated with respect to such considerations. In this paper, we remedy this situation by performing a detailed measurement study of the two popular peer-to-peer file sharing systems, namely Napster and Gnutella. In particular, our measurement study seeks to precisely characterize the population of end-user hosts that participate in these two systems. This characterization includes the bottleneck bandwidths between these hosts and the Internet at large, IP-level latencies to send packets to these hosts, how often hosts connect and disconnect from the system, how many files hosts share and download, the degree of cooperation between the hosts, and several correlations between these characteristics. Our measurements show that there is significant heterogeneity and lack of cooperation across peers participating in these systems.
Keywords
Peer-to-Peer, Network Measurements, Wide-Area Systems, Internet Services, Broadband.
Appeared in Proceedings of the Multimedia Computing and Networking (MMCN), San Jose, January, 2002.
1. INTRODUCTION
The popularity of peer-to-peer file sharing applications such as Gnutella and Napster has created a flurry of recent research activity into peer-to-peer architectures [1,2,3,4,5,6]. Although the exact definition of ``peer-to-peer'' is debatable, these systems typically lack dedicated, centralized infrastructure, but rather depend on the voluntary participation of peers to contribute resources out of which the infrastructure is constructed. Membership in a peer-to-peer system is ad-hoc and dynamic: as such, the challenge of such systems is to figure out a mechanism and architecture for organizing the peers in such a way so that they can cooperate to provide a useful service to the community of users. For example, in a file sharing application, one challenge is organizing peers into a cooperative, global index so that all content can be quickly and efficiently located by any peer in the system [2,3,4,6].
In order to evaluate a proposed peer-to-peer system, the characteristics of the peers that choose to participate in the system must be understood and taken into account. For example, if some peers in a file-sharing system have low-bandwidth, high-latency bottleneck network connections to the Internet, the system must be careful to avoid delegating large or popular portions of the distributed index to those peers, for fear of overwhelming them and making that portion of the index unavailable to other peers. Similarly, the typical duration that peers choose to remain connected to the infrastructure has implications for the degree of redundancy necessary to keep data or index metadata highly available. In short, the system must take into account the suitability of a given peer for a specific task before explicitly or implicitly delegating that task to the peer.
Surprisingly, however, few of the architectures currently being developed are evaluated with respect to such considerations. We believe that this is, in part, due to a lack of information about the characteristics of hosts that choose to participate in peer-to-peer systems. We are aware of a single previous study [7] that measures only one such characteristic, namely the number of files peers share. In this paper, we remedy this situation by performing a detailed measurement study of the two most popular peer-to-peer file sharing systems, namely Napster and Gnutella. The hosts that choose to participate in these systems are typically end-users' home or office machines, located at the ``edge'' of the Internet.
Our measurement study seeks to precisely characterize the population of end-user hosts that participate in these two systems. This characterization includes the bottleneck bandwidths between these hosts and the Internet at large, IP-level latencies to send packets to these hosts, how often hosts connect and disconnect from the system, how many files hosts share and download, and correlations between these characteristics. Our measurements consist of detailed traces of these two systems gathered over long periods of time --- four days for Napster and eight days for Gnutella respectively.
There are two main lessons to be learned from our measurement results. First, there is a significant amount of heterogeneity in both Gnutella and Napster; bandwidth, latency, availability, and the degree of sharing vary between three and five orders of magnitude across the peers in the system. This implies that any similar peer-to-peer system must be very careful about delegating responsibilities across peers. Second, peers tend to deliberately misreport information if there is an incentive to do so. Because effective delegation of responsibility depends on accurate information, this implies that future systems must have built-in incentives for peers to tell the truth, or systems must be able to directly measure or verify reported information.
2. METHODOLOGY
The methodology behind our measurements is quite simple. For each of the Napster and Gnutella systems, we proceeded in two steps. First, we periodically crawled each system in order to gather instantaneous snapshots of large subsets of the systems' user population. The information gathered in these snapshots include the IP address and port number of the users' client software, as well as some information about the users as reported by their software. Second, immediately after gathering a snapshot, we actively probed the users in the snapshot over a period of several days to directly measure various properties about them, such as their bottleneck bandwidth.
In this section of the paper, we first give a brief overview of the architectures of Napster and Gnutella. Following this, we then describe the software infrastructure that we built to gather our measurements, including the Napster crawler, the Gnutella crawler, and the active measurement tools used to probe the users discovered.
2.1 The Napster and Gnutella Architectures
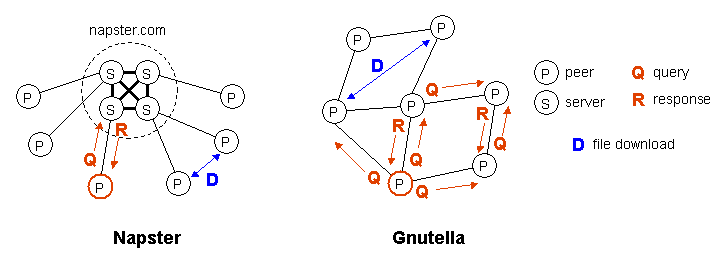
Both Napster and Gnutella have similar goals: to facilitate the location and exchange of files (typically images, audio, or video) amongst a large group of independent users connected through the Internet. In these systems, files are stored on the computers of the individual users or peers, and exchanged through a direct connection between the downloading and uploading peers, over an HTTP-style protocol. All peers in this system are symmetric: they all have the ability to function both as a client and a server. This symmetry distinguishes peer-to-peer systems from many conventional distributed system architectures. Though the process of exchanging files is similar in both systems, Napster and Gnutella differ substantially in how peers locate files (Figure 1).
Figure 1: File location in Napster and Gnutella
In Napster, a large cluster of dedicated central servers maintain an index of the files that are currently being shared by active peers. Each peer maintains a connection to one of the central servers, through which the file location queries are sent. The servers then cooperate to process the query and return a list of matching files and locations. On receiving the results, the peer may choose to initiate a file exchange directly from another peer. In addition to maintaining an index of shared files, the centralized servers also monitor the state of each peer in the system, keeping track of metadata such as the peers' reported connection bandwidth and the duration that the peer has remained connected to the system. This metadata is returned with the results of a query, so that the initiating peer has some information to distinguish possible download sites.
There are no centralized servers in Gnutella, however. Instead, Gnutella peers form an overlay network by forging point-to-point connections with a set of neighbors. To locate a file, a peer initiates a controlled flood of the network by sending a query packet to all of its neighbors. Upon receiving a query packet, a peer checks if any locally stored files match the query. If so, the peer sends a query response packet back towards the query originator. Whether or not a file match is found, the peer continues to flood the query through the overlay.
To help maintain the overlay as the users enter and leave the system, the Gnutella protocol includes ping and pong messages that help peers to discover other nodes. Pings and pongs behave similarly to query/query-response packets: any peer that sees a ping message sends a pong back towards the originator, and forwards the ping onwards to its own set of neighbors. Ping and query packets thus flood through the network; the scope of flooding is controlled with a time-to-live (TTL) field that is decremented on each hop. Peers occasionally forge new neighbor connections with other peers discovered through the ping/pong mechanism. Note that it is possible to have several disjoint Gnutella overlays of Gnutella simultaneously coexisting in the Internet; this contrasts with Napster, in which peers are always connected to the same cluster of central servers.
2.2 Crawling the Peer-to-Peer Systems
We now describe the design and implementation of our Napster and Gnutella crawlers.
2.2.1 The Napster Crawler
Because we did not have direct access to indexes maintained by the central Napster servers, the only way we could discover the set of peers participating in the system at any time was by issuing queries for files, and keeping a list of peers referenced in the queries' responses. To discover the largest possible set of peers, we issued queries with the names of popular song artists drawn from a long list downloaded from the web.
The Napster server cluster consists of approximately 160 servers; each peer establishes a connection with only one server. When a peer issues a query, the server the peer is connected to first reports files shared by ``local users'' on the same server, and later reports matching files shared by ``remote users'' on other servers in the cluster. For each crawl, we established a large number of connections to a single server, and issued many queries in parallel; this reduced the amount of time taken to gather data to 3-4 minutes per crawl, giving us a nearly instantaneous snapshot of peers connected to that server. For each peer that we discovered during the crawl, we then queried the Napster server to gather the following metadata: (1) the bandwidth of the peer's connection as reported by the peer herself, (2) the number of files currently being shared by the peer, (3) the current number of uploads and the number of downloads in progress by the peer, (4) the names and sizes of all the files being shared by the peer, and (5) the IP address of the peer.
To get an estimate of the fraction of the total user population we captured, we separated the local and remote peers returned in our queries' responses, and compared them to statistics periodically broadcast by the particular Napster server that we queried. From these statistics, we verified that each crawl typically captured between 40\% and 60\% of the local peers on the crawled server. Furthermore, this 40-60\% of the peers that we captured contributed between 80-95\% of the total (local) files reported to the server. Thus, we feel that our crawler captured a representative and significant fraction of the set of peers.
Our crawler did not capture any peers that do not share any of the popular content in our queries. This introduces a bias in our results, particularly in our measurements that report the number of files being shared by users. However, the statistics reported by the Napster server revealed that the distributions of number of uploads, number of downloads, number of files shared, and bandwidths reported for all remote users were quite similar to those that we observed from our captured local users.
2.2.1 The Gnutella Crawler
The goal of our Gnutella crawler is the same as our Napster crawler: to gather nearly instantaneous snapshots of a significant subset of the Gnutella population, as well as metadata about peers in captured subset as reported by the Gnutella system itself. Our crawler exploits the ping/pong messages in the protocol to discover hosts. First, the crawler connects to several well-known, popular peers (such as gnutellahosts.com or router.limewire.com). Then, it begins an iterative process of sending ping messages with large TTLs to known peers, adding newly discovered peers to its list of known peers based on the contents of received pong messages. In addition to the IP address of a peer, each pong message contains metadata about the peer, including the number and total size of files being shared.
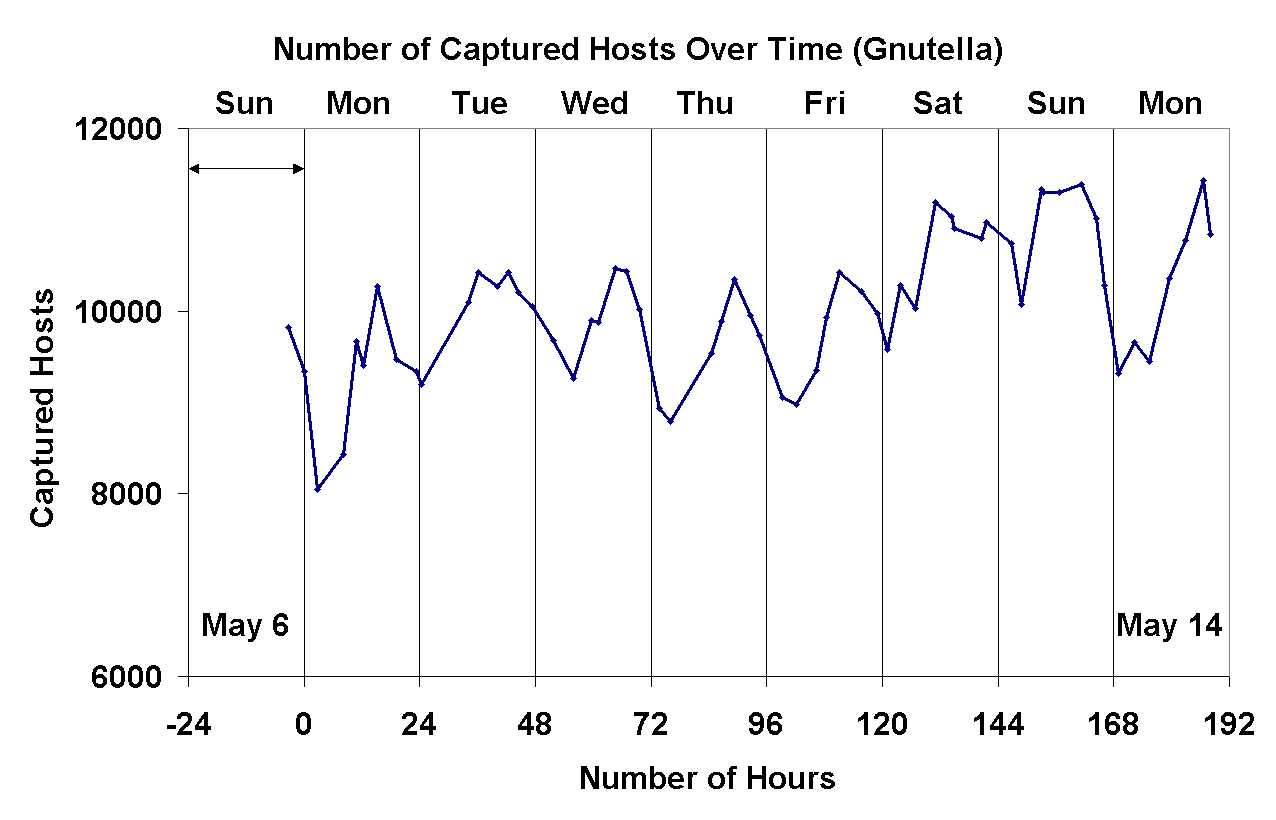
Figure 2: Number of Gnutella hosts captured by our crawler over time
We allowed our crawler to continue iterating for approximately two minutes, after which it would typically gather between 8,000 and 10,000 unique peers (Figure 2). According to measurements reported by Clip2 [8], this corresponds to at least 25% to 50% of the total population of peers in the system at any time. After two minutes, we would terminate the crawler, save the crawling results to a file and begin another crawl iteration to gather our next snapshot of the Gnutella population.
Unlike our Napster measurements, in which we were more likely to capture hosts sharing popular songs, we have no reason to suspect any bias in our measurements of the Gnutella user population. Furthermore, to ensure that the crawling process does not alter the behavior of the system in any way, our crawler neither forwarded any Gnutella protocol messages nor answered any queries.
2.2.3 Crawler Statistics
Both the Napster and Gnutella crawlers were written in Java, and ran using the IBM Java 1.18 JRE on Linux 2.2.16. The crawlers ran in parallel on a small number of dual-processor Pentium III 700 MHz computers with 2GB RAM, and four 40GB SCSI disks. Our Napster trace captured four days of activity, from Sunday May 6th, 2001 through Wednesday May 9th, 2001. We recorded a total of 509,538 Napster peers on 546,401 unique IP addresses. Our Gnutella trace spanned eight days (Sunday May 6th, 2001 through Monday May 14th, 2001) and captured 1,239,487 Gnutella peers on 1,180,205 unique IP-addresses.
2.3 Directly Measured Peer Characteristics
For each gathered peer population snapshot, we directly measured additional properties of the peers. Our goal was to capture data that would enable us to reason about the fundamental characteristics of the users (both as individuals and as a population) participating in any peer-to-peer file sharing system. The data collected includes the distributions of bottleneck bandwidths and latencies between peers and our measurement infrastructure, the number of shared files per peer, the distribution of peers across DNS domains, and the ``lifetime'' of the peers in the system, i.e., how frequently peers connect to the systems, and how long they remain connected.
2.3.1 Latency Measurements
Given the list of peers' IP-addresses obtained by the crawlers, we measured the round-trip latency between the peers and our measurement machines. For this, we used a simple tool that measures the RTT of a 40-byte TCP packet exchanged between a peer and our measurement host. Our interest in latencies of the peers is due to the well known feature of TCP congestion control which discriminates against flows with large round-trip times. This, coupled with the fact that the average size of files exchanged is in the order of 2-4 MB, makes latency a very important consideration when selecting amongst multiple peers sharing the same file. Although we realize that the latency to any particular peer is dependent on the location of the host from which it is measured, we feel the distribution of latencies over the entire population of peers from a given host might be similar (but not identical) from different hosts, and hence, could be of interest.
2.3.2 Lifetime Measurements
To gather measurements of the lifetime characteristics of peers, we
needed a tool that would periodically probe a large set of peers from
both systems to detect when they were participating in the system.
Every peer in both Napster and Gnutella connects to the system using a
unique IP-address/port-number pair; to download a file, peers connect
to each other using these pairs. There are therefore three possible states
for any participating peer in either Napster or Gnutella:
We developed a simple tool (which we call LF}) using Savage's ``Sting'' platform [9]. To detect the state of a host, LF sends a TCP SYN-packet to the peer and then waits for up to twenty seconds to receive any packets from it. If no packet arrives, we mark the peer as offline. If we receive a TCP RST packet, we mark the peer as inactive. If we receive a TCP SYN/ACK, we label the host as active, and send back a RST packet to terminate the connection. We chose to manipulate TCP packets directly rather than use OS socket calls to achieve greater scalability; this enabled us to monitor the lifetimes of tens of thousands of hosts per workstation. Because we identify a host by its IP address, one limitation in the lifetime characterization of peers our inability of distinguishing hosts sharing dynamic IP addresses (e.g. DHCP).
2.3.3 Bottleneck Bandwidth Measurements
Another characteristic of peers that we wanted to gather was the speed of their connections to the Internet. This is not a precisely defined concept: the rate at which content can be downloaded from a peer depends on the bottleneck bandwidth between the downloader and the peer, the available bandwidth along the path, and the latency between the peers.
The central Napster servers can provide the connection bandwidth of any peer as reported by the peer itself. However, as we will show later, a substantial percentage of the Napster peers (as high as 25%) choose not to report their bandwidths. Furthermore, there is a clear incentive for a peer to discourage other peers from downloading files by falsely reporting a low bandwidth. The same incentive to lie exists in Gnutella; in addition to this, in Gnutella, bandwidth is reported only as part of a successful response to a query, so peers that share no data or whose content does not match any queries never report their bandwidths.
Because of this, we decided to actively probe the bandwidths of peers. There are two difficult problems with measuring the available bandwidth to and from a large number of hosts: first, available bandwidth can significantly fluctuate over short periods of time, and second, available bandwidth is determined by measuring the loss rate of an open TCP connection. Instead, we decided to use the bottleneck link bandwidth as a first-order approximation to the available bandwidth; because our workstations are connected by a gigabit link to the Abilene network, it is likely that the bottleneck link between our workstations and any peer in these systems is last-hop link to the peer itself. This is particularly likely since, as we will show later, most peers are connected to the system using low-speed modems or broadband connections such as cable modems or DSL. Thus, if we could characterize the bottleneck bandwidth between our measurement infrastructure and the peers, we would have a fairly accurate upper bound on the rate at which information could be downloaded from these peers.
Bottleneck link bandwidth between two different hosts equals the capacity of the slowest hop along the path between the two hosts. Thus, by definition, bottleneck link bandwidth is a physical property of the network that remains constant over time for an individual path.
Although various bottleneck link bandwidth measurement tools are available [10,11,12,13], for a number of reasons that are beyond the scope of this paper, all of these tools were unsatisfactory for our purposes. Hence, we developed our own tool (called SProbe) [14] based on the same underlying packet-pair dispersion technique as some of the above-mentioned tools. Unlike other tools, however, SProbe uses tricks inspired by Sting [9] to actively measure both upstream and downstream bottleneck bandwidths using only a few TCP packets. Our tool also proactively detects cross-traffic that interferes with the accuracy of the packet-pair technique, improving the overall accuracy of our measurements (for more information about SProbe, refer to http://sprobe.cs.washington.edu). By comparing the reported bandwidths of the peers with our measured bandwidths, we were able to verify the consistency and accuracy of SProbe, as we will demonstrate in Section 3.5.
2.3.4 A Summary of the Active Measurements
For the lifetime measurements, we monitored 17,125 Gnutella peers over a period of 60 hours and 7,000 Napster peers over a period of 25 hours. For each Gnutella peer, we determined its status (offline, inactive or active) once every seven minutes, and for each Napster peer, once every two minutes.
For Gnutella, we attempted to measure bottleneck bandwidths and latencies to a random set of 595,974 unique peers (i.e., unique IP-address/port-number pairs). We were successful in gathering downstream bottleneck bandwidth measurements to 223,552 of these peers, the remainder of which were either offline or had significant cross-traffic. We measured upstream bottleneck bandwidths from 16,252 of the peers (for various reasons, upstream bottleneck bandwidth measurements from hosts are much harder to obtain than downstream measurements to hosts [14]). Finally, we were able to measure latency to 339,502 peers. For Napster, we attempted to measure downstream bottleneck bandwidths to 4,079 unique peers. We successfully measured 2,049 peers.
In several cases, our active measurements were regarded as intrusive by several monitored systems. Unfortunately, e-mail complaints received by the computing staff at the University of Washington forced us to prematurely terminate our crawls, hence the lower number of monitored Napster hosts. Nevertheless, we successfully captured a significant number of data points for us to believe that our results and conclusions are representative for the entire Napster population.
3. MEASUREMENT RESULTS
Our measurement results are organized according to a number of basic questions addressing the capabilities and behavior of peers. In particular, we attempt to address how many peers are capable of being servers, how many behave like clients, how many are willing to cooperate, and also how well the Gnutella network behaves in the face of random or malicious failures.
3.1 How Many Peers Fit the High-Bandwidth, Low-Latency Profile of a Server?
One particularly relevant characteristic of peer-to-peer file sharing systems is the percentage of peers in the system having server-like characteristics. More specifically, we are interested in understanding what percentage of the participating peers exhibit the server-like characteristics with respect to their bandwidths and latencies. Peers worthy of being servers must have high-bandwidth Internet connections, they should remain highly available, and the latency of access to the peers should generally be low. If there is a high degree of heterogeneity amongst the peers, a well-designed system should pay careful attention to delegating routing and content-serving responsibilities, favoring server-like peers.
|
|
|---|---|
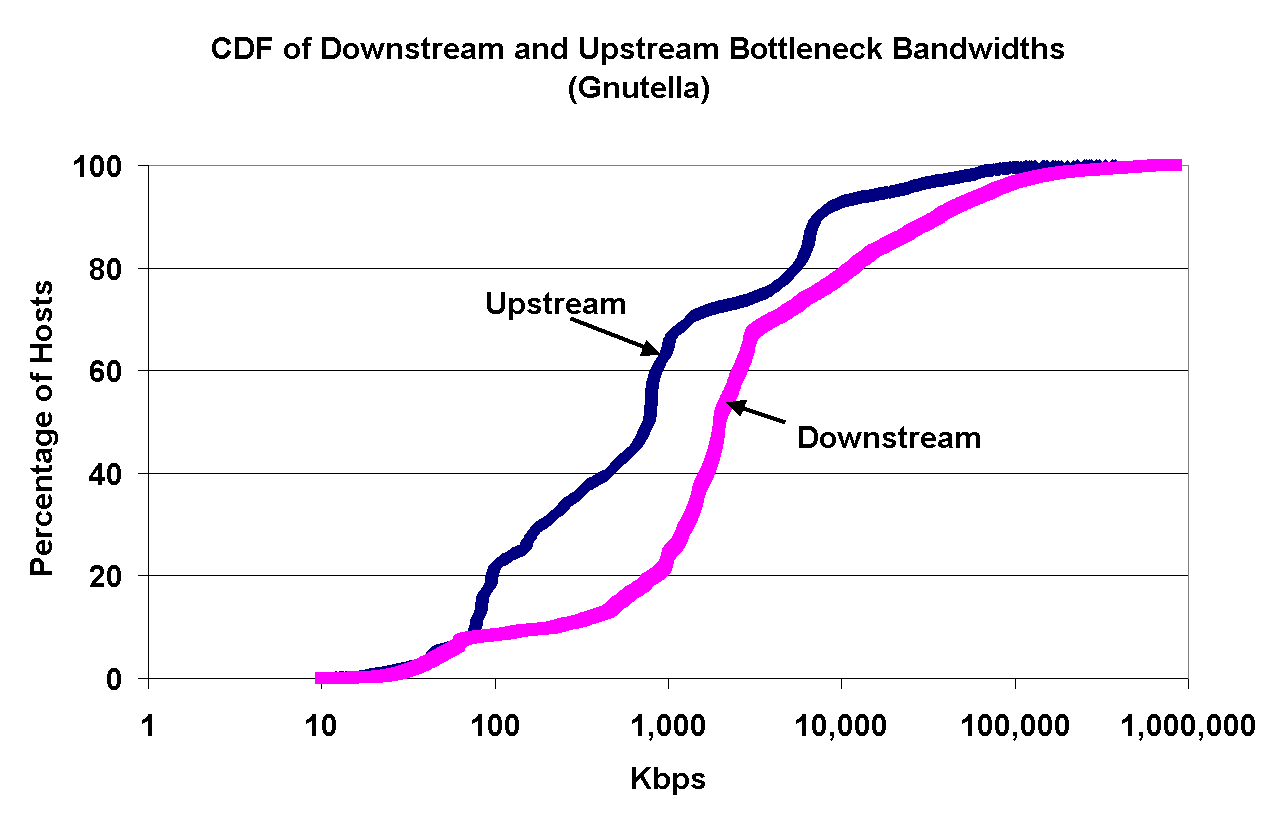
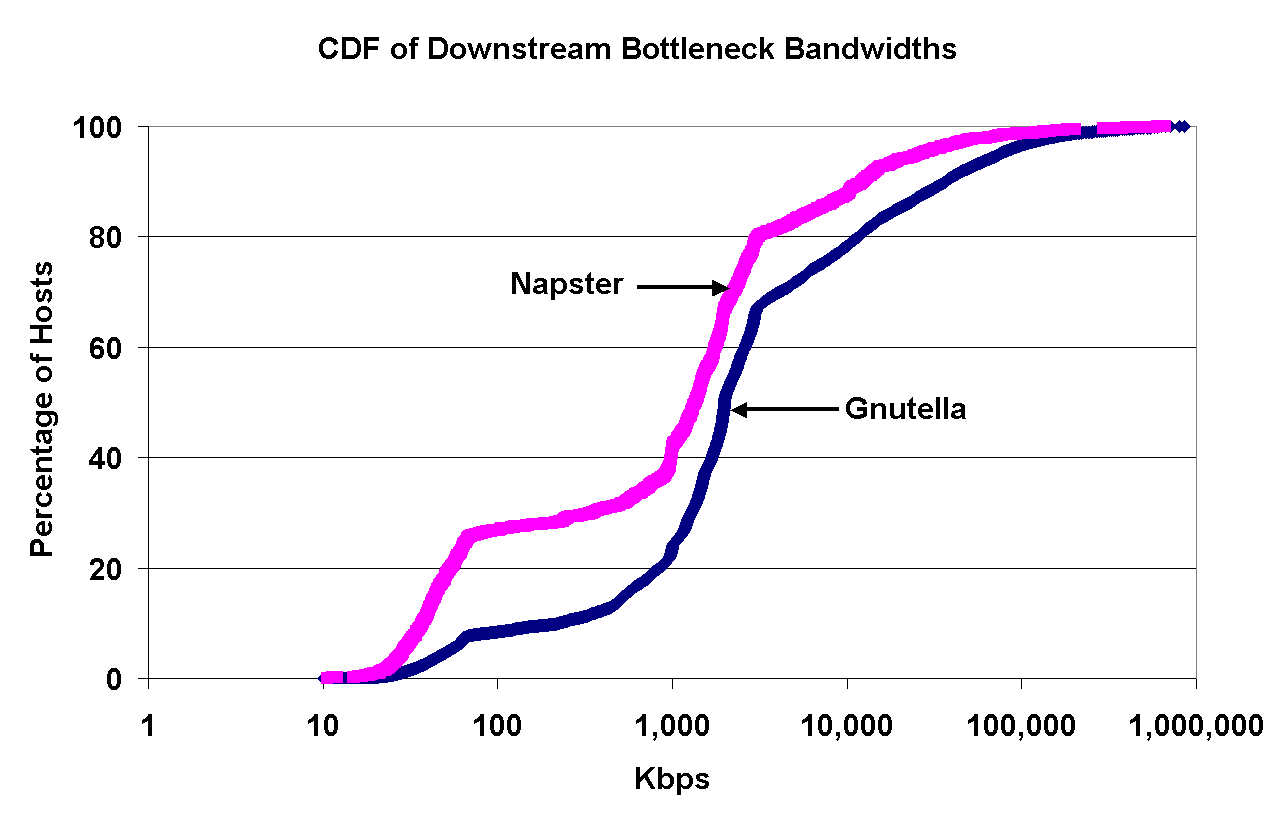
Figure 3: Left: CDFs of upstream and downstream bottleneck bandwidths for Gnutella peers; Right: CDFs of downstream bottleneck bandwidths for Napster and Gnutella peers. | |
3.1.1 Downstream and Upstream Measured Bottleneck Link Bandwidths
To fit the profile of a high-bandwidth server, a participating peer must have a high upstream bottleneck link bandwidth, since this value determines the rate at which a server can serve content. On the left, Figure 3 presents cumulative distribution functions (CDFs) of upstream and downstream bottleneck bandwidths for Gnutella peers (``Upstream'' denotes traffic from the peer to the measurement node; ``downstream'' denotes traffic from the measurement node to the peer). From this graph, we see that while 92% of the participating peers have downstream bottleneck bandwidths of at least 100Kbps, only 8% of the peers have upstream bottleneck bandwidths of at least 10Mbps. Moreover, 22% of the participating peers have upstream bottleneck bandwidths of 100Kbps or less. Not only are these peers unsuitable to provide content and data, they are particularly susceptible to being swamped by a relatively small number of connections.
The left graph in Figure 3 reveals asymmetry in the upstream and downstream bottleneck bandwidths of Gnutella peers. On average, a peer tends to have higher downstream than upstream bottleneck bandwidth; this is not surprising, because a large fraction of peers depend on asymmetric links such as ADSL, cable modems or regular modems using the V.90 protocol [15]. Although this asymmetry is beneficial to peers that download content, it is both undesirable and detrimental to peers that serve content: in theory, the download capacity of the system exceeds its upload capacity. We observed a similar asymmetry in the Napster network.
The right graph in Figure 3 presents CDFs of downstream bottleneck bandwidths for Napster and Gnutella peers. As this graph illustrates, the percentage of Napster users connected with modems (of 64Kbps or less) is about 25%, while the percentage of Gnutella users with similar connectivity is as low as 8%.
At the same time, 50% of the users in Napster and 60% of the users in Gnutella use broadband connections (Cable, DSL, T1 or T3). Furthermore, only about 20% of the users in Napster and 30% of the users in Gnutella have very high bandwidth connections (at least 3Mbps). Overall, Gnutella users on average tend to have higher downstream bottleneck bandwidths than Napster users. Based on our experience, we attribute this difference to two factors: (1) the current flooding-based Gnutella protocol is too high of a burden on low bandwidth connections, discouraging them from participating, and (2) although unverifiable, there is a widespread belief that Gnutella is more popular to technically-savvy users, who tend to have faster Internet connections.
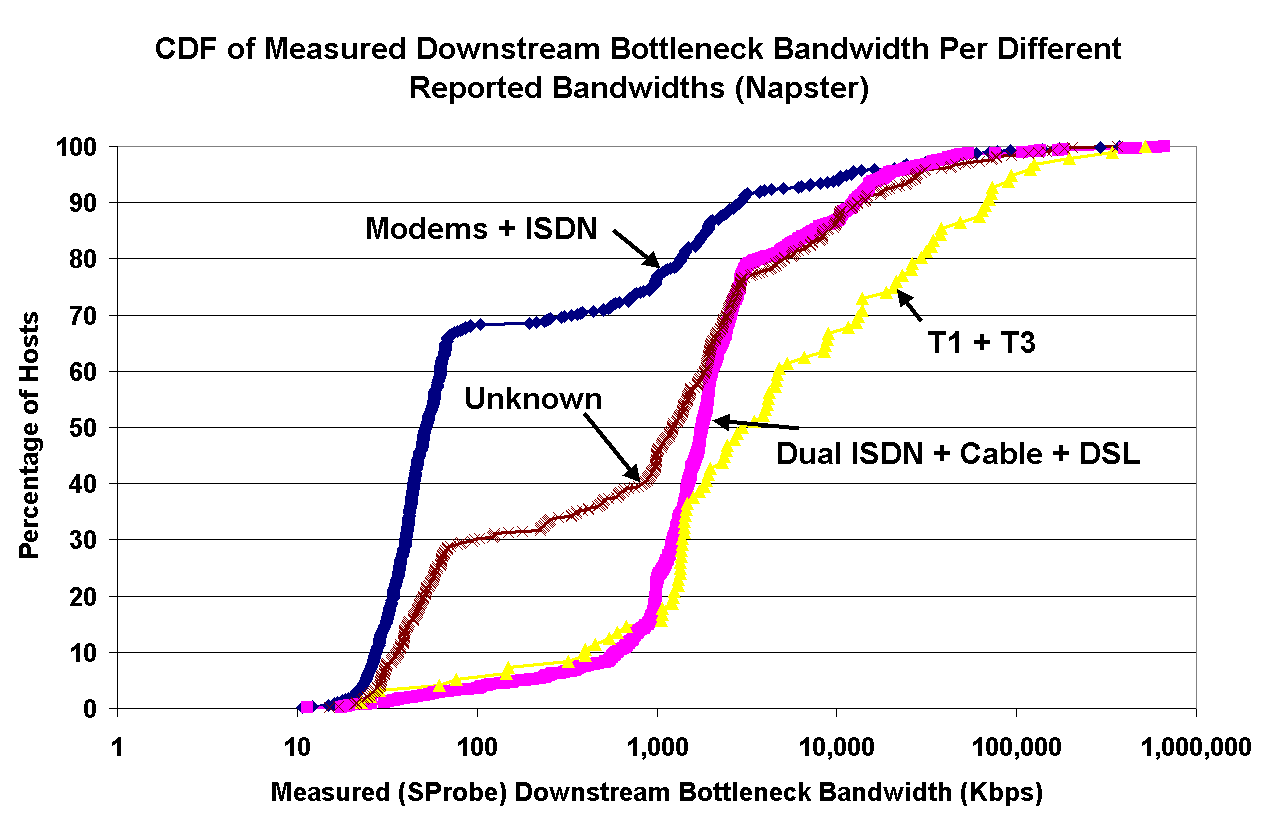
3.1.2 Reported Bandwidths for Napster Peers
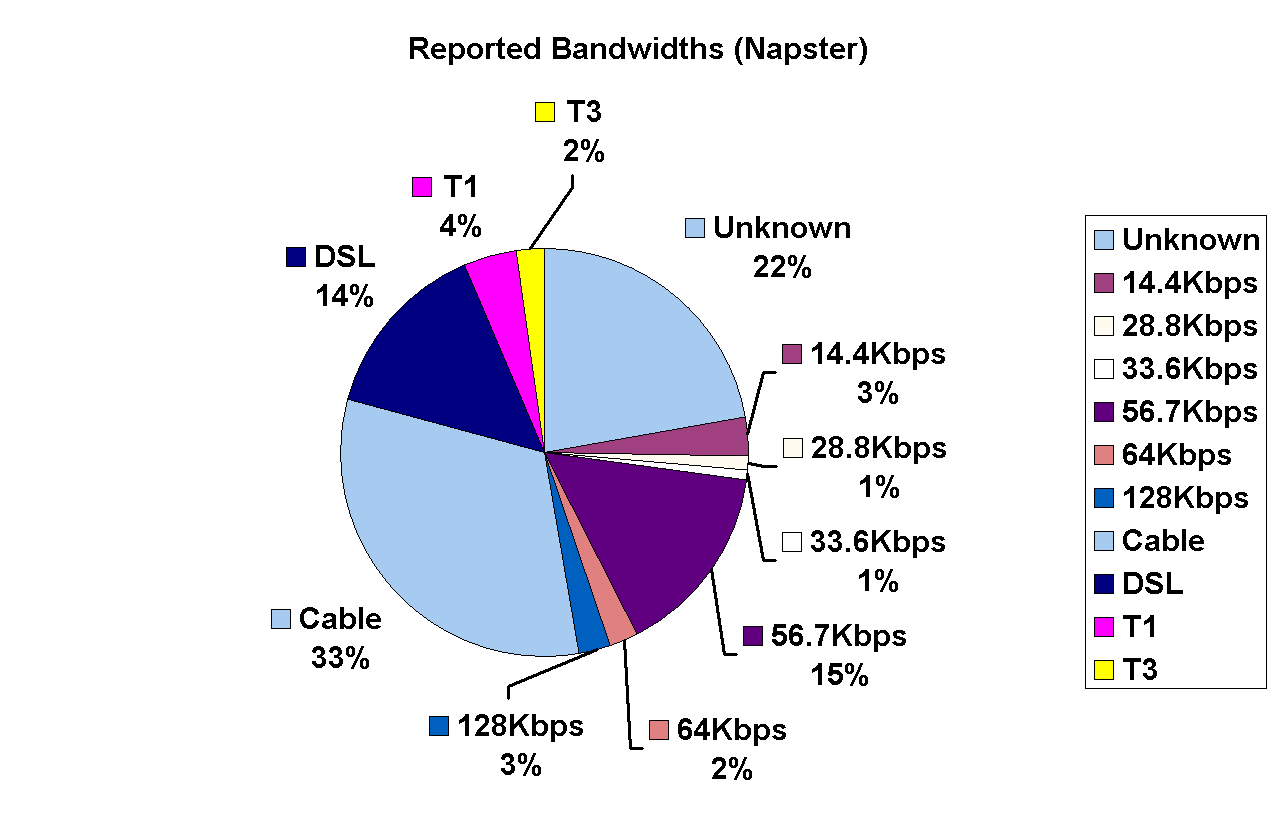
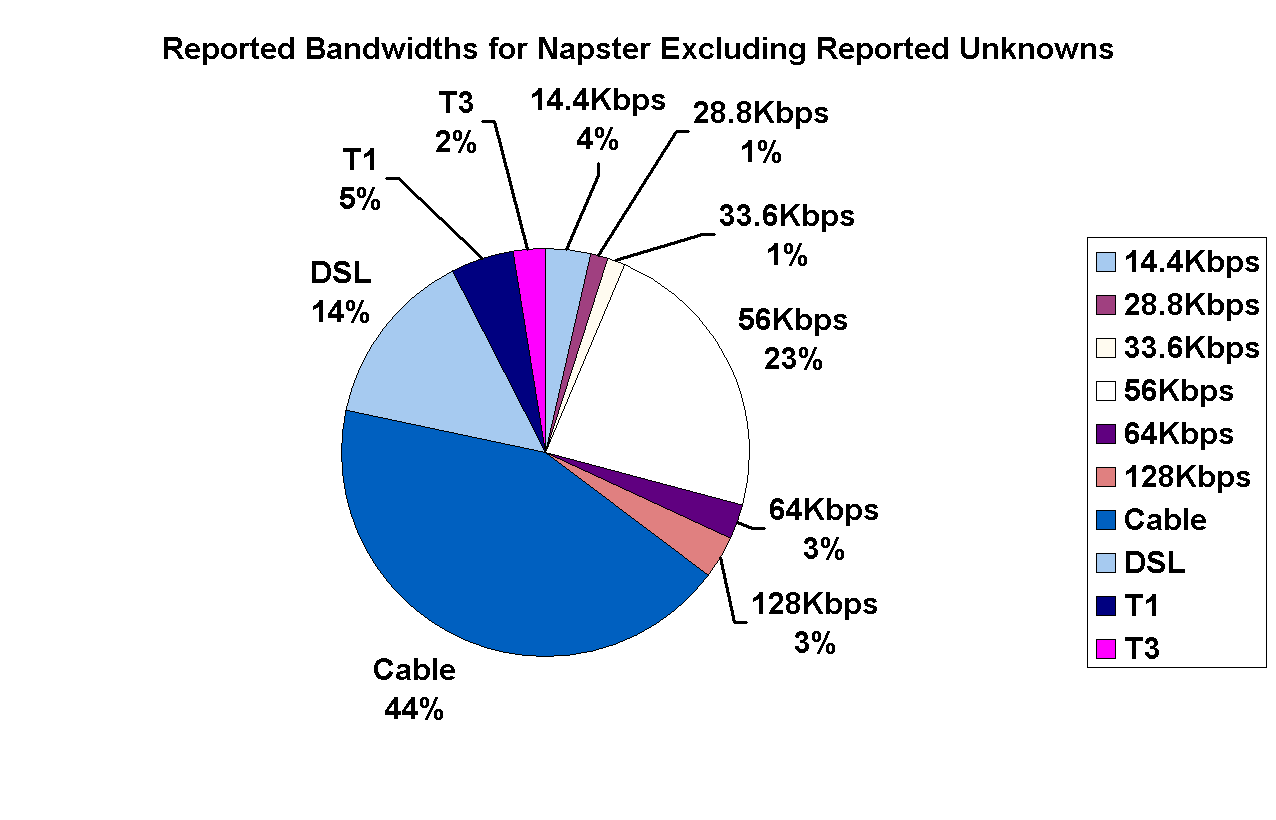
Figure 4 illustrates the breakdown of Napster peers with respect to their voluntarily reported bandwidths; the bandwidth that is reported is selected by the user during the installation of the Napster client software. (Peers that report ``Unknown'' bandwidth have been excluded in the right graph.)
|
|
|---|---|
Figure 4: Left: Reported bandwidths For Napster peers; Right: Reported bandwidths for Napster peers, excluding peers that reported ``unknown''. | |
As Figure 4 shows, a significant percent of the Napster users (22%) report ``Unknown''. These users are either unaware of their connection bandwidths, or they have no incentive to accurately report their true bandwidth. Indeed, knowing a peer's connection speed is more valuable to others rather than to the peer itself; a peer that reports high bandwidth is more likely to receive download requests from other peers, consuming network resources. Thus, users have an incentive to misreport their Internet connection speeds. A well-designed system therefore must either directly measure the bandwidths rather than relying on a user's input, or create the right incentives for the users to report accurate information to the system.
Finally both Figures 3 and 4 confirm that the most popular forms of Internet access for Napster and Gnutella peers are cable modems and DSLs (bottleneck bandwidths between 1Mbps and 3.5Mbps).
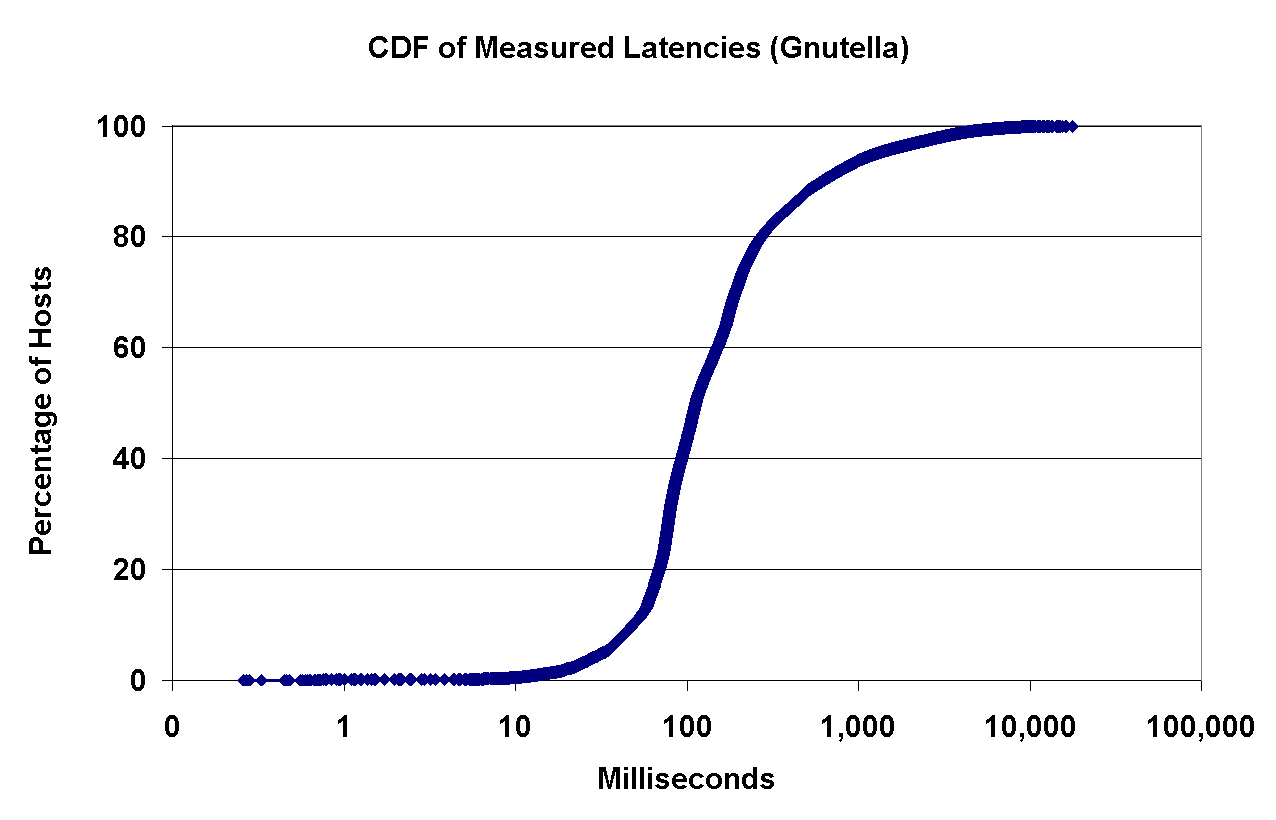
3.1.3 Measured Latencies for Gnutella Peers
Figure 5 (left) shows a CDF of the measured latencies from our measurement nodes to Gnutella peers. Approximately 20% of the peers have latencies of at least 280ms, whereas another 20% have latencies of at most 70ms: the closest 20% of the peers are four times closer than the furthest 20%. From this, we can deduce that in a peer-to-peer system where peers' connections are forged in an unstructured, ad-hoc way, a substantial fraction of the connections will suffer from high-latency.
|
|
|---|---|
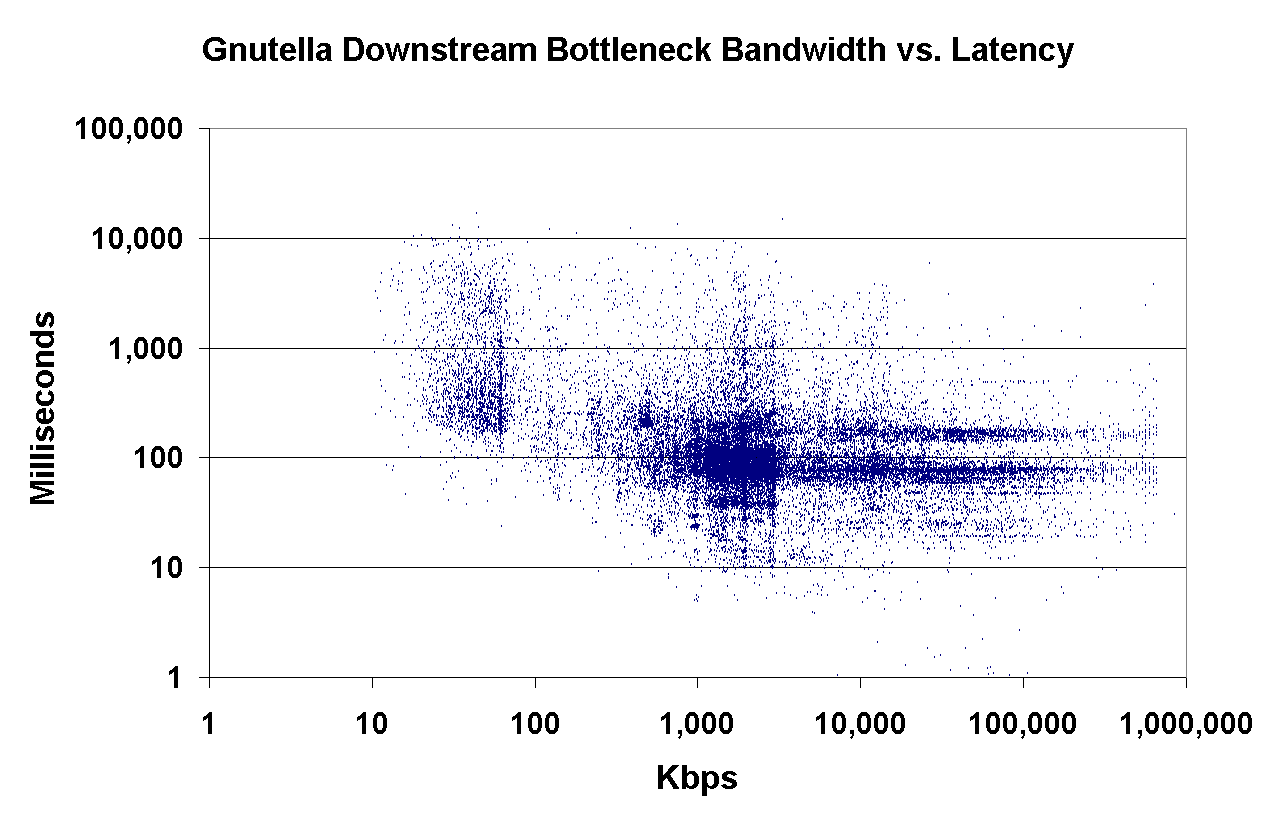
Figure 5: Left: Measured latencies to Gnutella peers; Right: Correlation between Gnutella peers' downstream bottleneck bandwidth and latency. | |
On the right, Figure 5 shows the correlation between downstream bottleneck bandwidth and the latency of individual Gnutella peers (on a log-log scale). This graph illustrates the presence of two clusters; a smaller one situated at (20-60Kbps, 100-1,000ms) and a larger one at over (1,000Kbps, 60-300ms). These clusters correspond to the set of modems and broadband connections, respectively. The negatively sloped lower-bound evident in the low-bandwidth region of the graph corresponds to the non-negligible transmission delay of our measurement packets through the low-bandwidth links.
An interesting artifact evident in this graph is the presence of two pronounced horizontal bands. These bands correspond to peers situated on the North American East Coast and in Europe, respectively. Although the latencies presented in this graph are relative to our location (Seattle, WA), these results can be extended to conclude that there are three large classes of latencies that a peer interacts with: (1) latencies to peers on the same part of the continent, (2) latencies to peers on the opposite part of a continent and (3) latencies to trans-oceanic peers. As Figure 5 shows, the bandwidths of the peers fluctuate significantly within each of these three latency classes.
3.2 How Many Peers Fit the High-Availability Profile of a Server?
Server worthiness is characterized not only by high-bandwidth and low-latency network connectivity, but also by the availability of the server. If, peers tend to be unavailable frequently, this will have significant implications about the degree of replication necessary to ensure that content is consistently accessible on this system.
|
|
|---|---|
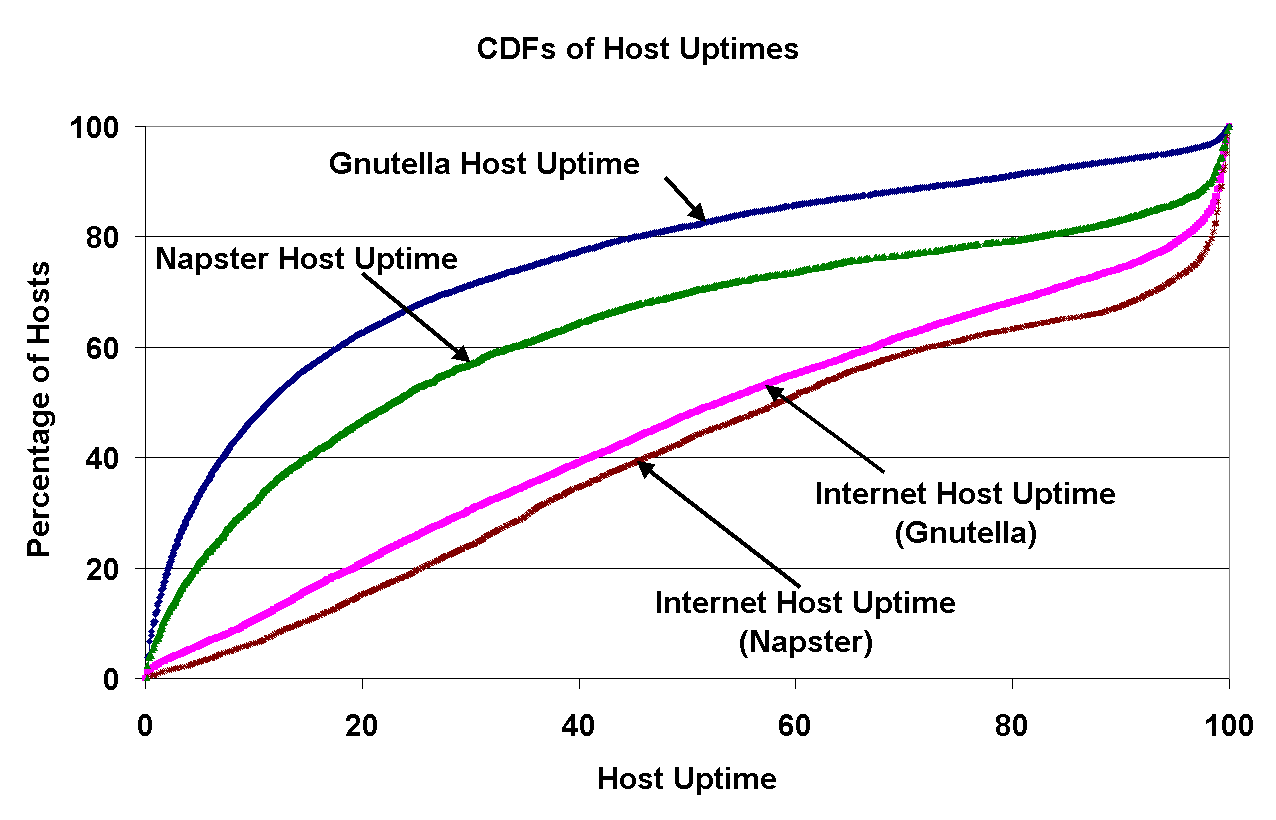
Figure 6: Left: IP-level uptime of peers (``Internet Host Uptime''), and application-level uptime of peers (``Gnutella/Napster Host Uptime'') in both Napster and Gnutella, as measured by the percentage of time the peers are reachable; Right: The distribution of Napster/Gnutella session durations. | |
On the left, Figure 6 shows the distribution of uptimes of peers for both Gnutella and Napster. Uptime is measured as the percentage of time that the peer is available and responding to traffic. The ``Internet host uptime'' curves represent the uptime as measured at the IP-level, i.e., peers that are in the inactive or active states, as defined in Section 2.3.2. The ``Gnutella/Napster host uptime'' curves represent the uptime of peers in the active state, and therefore responding to application-level requests. For all curves, we have eliminated peers that had 0% uptime (peers that were never up throughout our lifetime experiment).
The IP-level uptime characteristics of peers are quite similar for both systems; this implies that the set of peers participating in either Napster or Gnutella are homogeneous with respect to their IP-level uptime. In addition, only 20% of the peers in each system had an IP-level uptime of 93% or more.
In contrast, the application-level uptime characteristics of peers differ noticeably between Gnutella and Napster. On average, Napster peers tend to participate in the system more often than Gnutella peers. One might hastily conclude that since more users participate in Napster, more content is available and therefore peers have, on average, longer uptimes. However, this data can also be used to draw an opposite conclusion: more content means that users can find the files of interest faster, which results in shorter uptimes. We believe that this difference is primarily a factor of the design of the client software; Napster's software has several features (such as a built-in chat client and an MP3 player) that cause users to run it for longer periods of time.
Another significant difference can be observed in the tail of the application-level distributions: the best 20% of Napster peers have an uptime of 83% or more, while the best 20% of Gnutella peers have an uptime of 45% or more. Our (unproven) hypothesis is that Napster is, in general, a higher quality and more useful service, and that this has a large influence on the uptime of its peers relative to Gnutella.
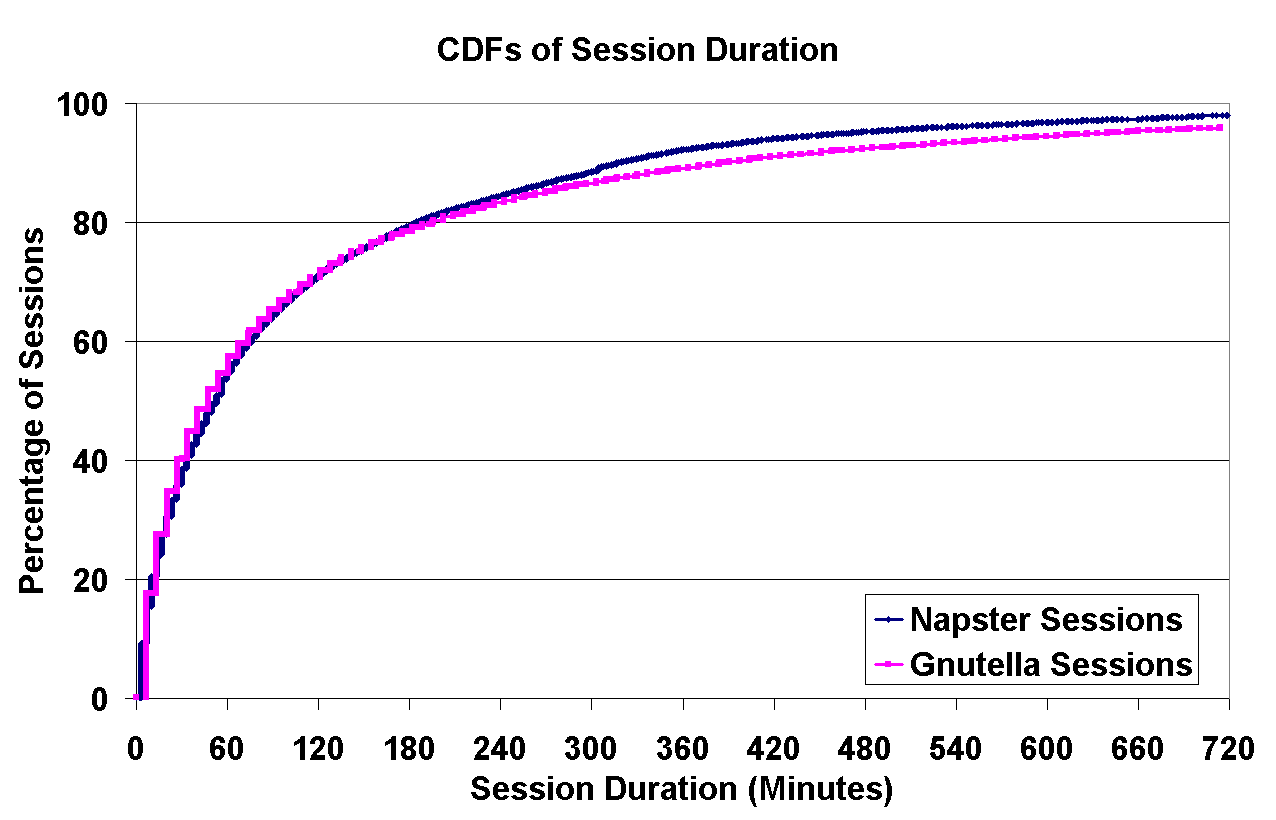
On the right, Figure 6 presents the CDF of Napster and Gnutella session durations that are less than twelve hours. The graph is limited to twelve hours because of the nature of our analysis method; we used the create-based method [16], in which we divided the captured traces into two halves. The reported durations are only for sessions that started in the first half, and finished in either the first or second half. This method provides accurate information about the distribution of session durations for session that are shorter than half of our trace, but it cannot provide any information at all about sessions that are longer than half our trace (this method is necessary, since sessions may be active (or inactive) for periods that are far longer than our trace duration; these long sessions, if unaccounted, would skew the results).
There is an obvious similarity between Napster and Gnutella; for both, most sessions are quite short---the median session duration is approximately 60 minutes. This is not surprising, as it corresponds to the time it typically takes for a user to download a small number of music files from the service.
3.3 How Many Peers Fit the No-Files-to-Share, Always-Downloading Profile of a Client?
In addition to understanding the percentage of server-like Napster and Gnutella peers, it is equally important to determine the number of client-like peers. One aspect of a client-like behavior is that little or no data is shared in the system. Previous studies refer to these peers as free-riders [7] in the system.
Another variable of interest is the number of downloads and uploads a participating peer is performing at any given time. A peer with a high number of downloads fits the profile of a client, whereas a peer with a high number of uploads fits the profile of a server. In addition, correlating the number of downloads with a peer's bandwidth should depict a clear picture as to how many of the participating peers bring no benefits to the system, i.e., they have no files to share, they have low bandwidths, and they always download files.
Although we believe that any peer-to-peer system will have its free-riders, the system should not treat its peers equally, but instead, it should create incentives and rewards for peers to provide and exchange data.
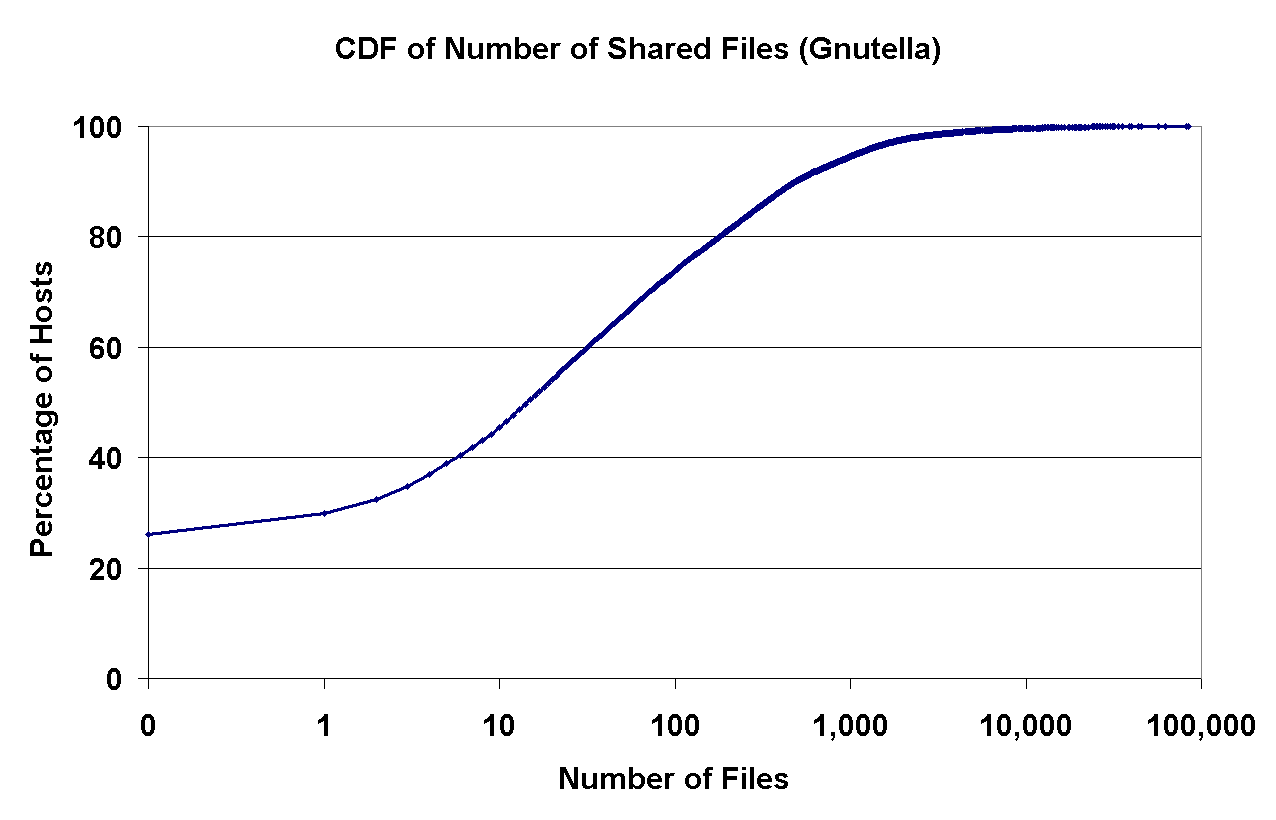
3.3.1 Number of Shared Files in Napster and Gnutella
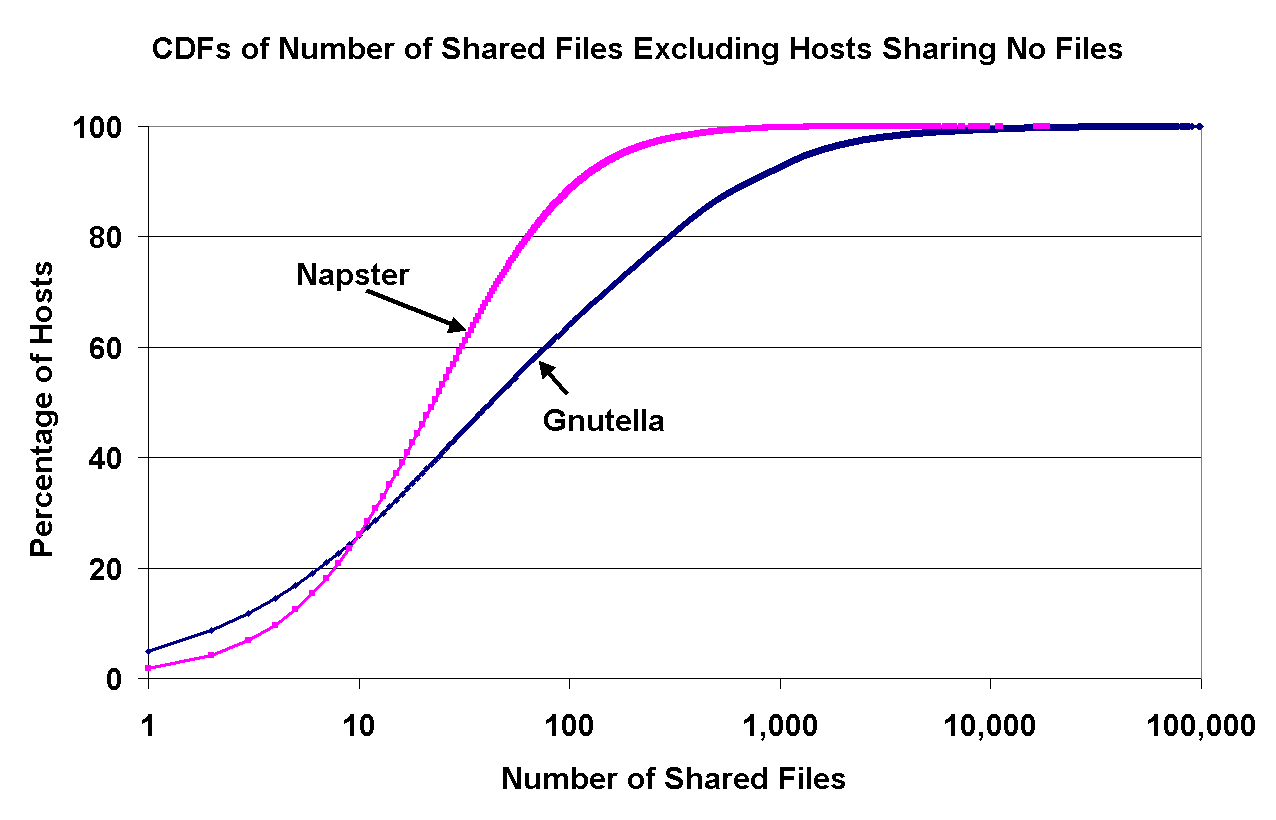
In Figure 7, the left graph shows the distribution of shared files across Gnutella peers, and the right graph shows this distribution for both Napster and Gnutella, but with peers sharing no files eliminated from the graph. (As previously mentioned, we could not capture any information about peers with no files from Napster.)
|
|
|---|---|
Figure 7: Left: The number of shared files for Gnutella peers; Right: The number of shared files for Napster and Gnutella peers (peers with no files to share are excluded). | |
From the left graph, we see that as high as 25% of the Gnutella clients do not share any files. Furthermore, about 75% of the clients share 100 files or less, whereas only 7% of the clients share more than 1000 files. A simple calculation reveals that these 7% of users together offer more files than all of the other users combined. This fact illustrates that in spite of claims that every peer is both a server and a client, Gnutella has an inherently large percentage of free-riders.
The right graph shows that Napster peers are slightly more consistent and offer less variation in the number of shared files than Gnutella peers. Nonetheless, about 40-60% of the peers share only 5-20% of the shared files, which indicates that there is a large amount of free-riding in Napster as well.
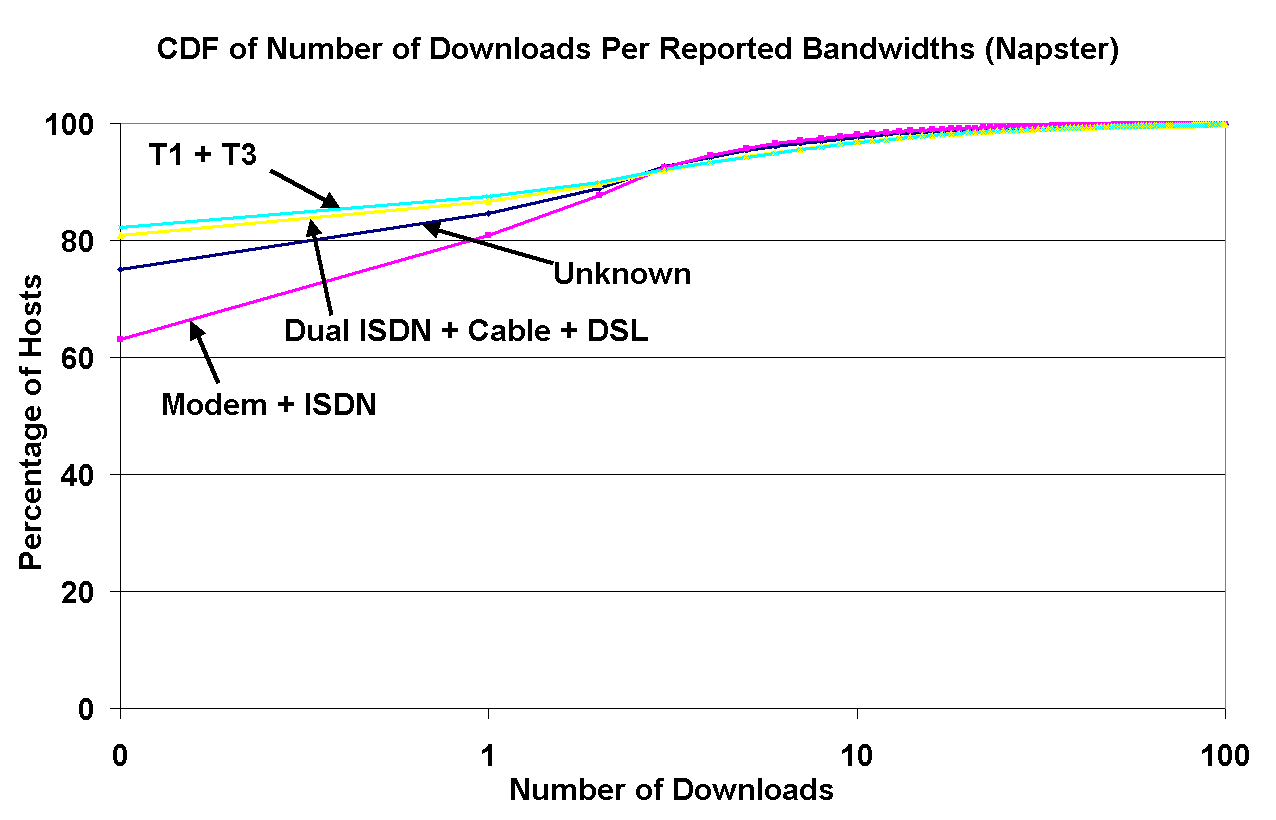
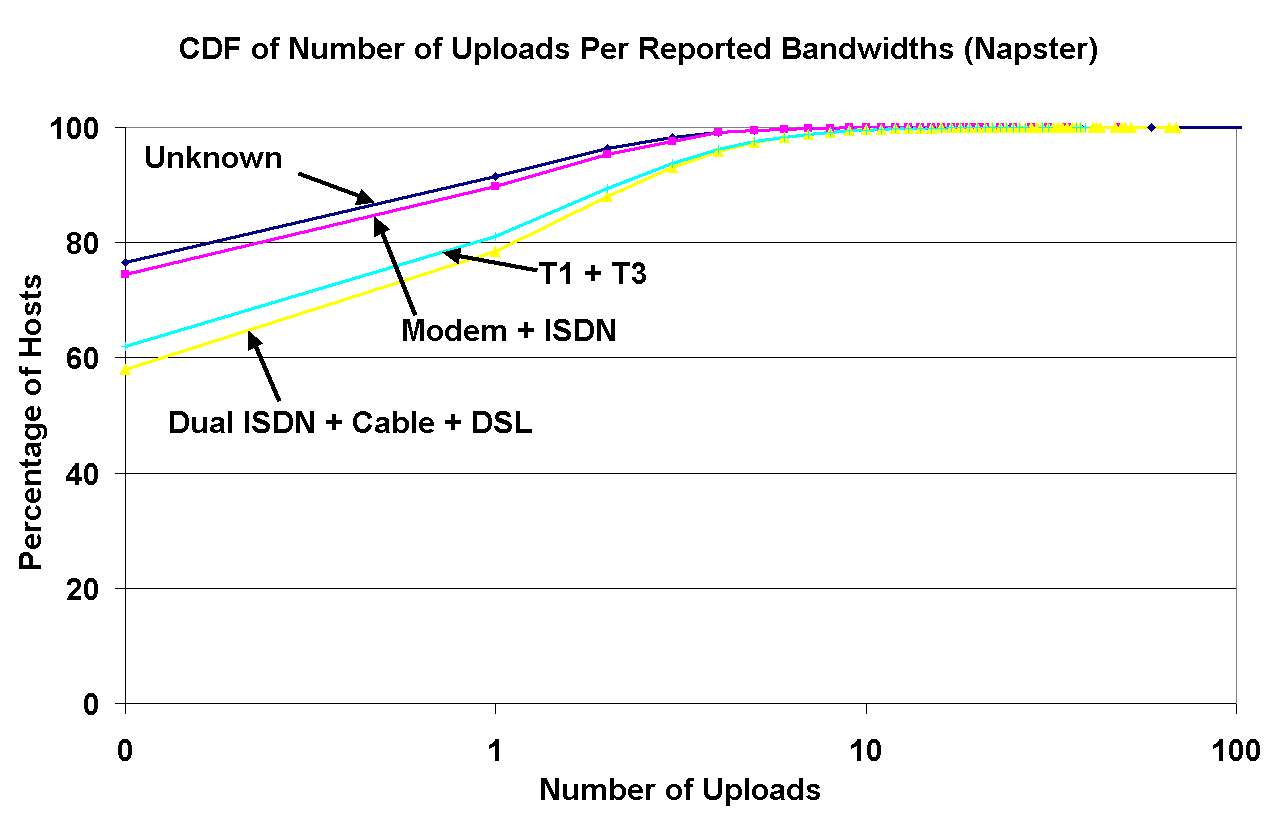
3.3.2 Number of Downloads and Uploads in Napster
In Figure 8, the left graph shows the distribution of concurrent downloads by Napster peers classified by the peer's reported bandwidth, and the right graph shows a similar curve for the number of concurrent uploads. Because these graphs were obtained by capturing snapshots of the download and upload activity using our crawler, these distributions are slightly biased towards capturing low-bandwidth peers, since downloads take longer through low-bandwidth connections.
|
|
|---|---|
Figure 8: Left: The number of downloads by Napster users, grouped by their reported bandwidths; Right: The number of uploads by Napster users, grouped by their reported bandwidths. | |
Nonetheless, this graph shows interesting correlations between peers' reported bandwidths and their concurrent downloads and uploads. First, there are 20% more zero-download high-speed peers than zero-download low-speed peers. We see two possible explanations: either higher-bandwidth peers tend to download less often, or they spend less time downloading because they have higher connection speeds. Second, the correlation between bandwidths and the downloads is reversed relative to bandwidths and uploads (the percentage of zero-upload peers is higher for modems than for cable modems).
3.3.3 Correlation between the Number of Downloads, Uploads, and Shared Files
Figure 9 shows the percentage of downloads, the percentage of the peer population, the percentage of uploads and the percentage of shared files, grouped according to the reported bandwidth from Napster peers. The number of shared files seems to be uniformly distributed across the population: the percentage of peers in each bandwidth class is roughly the same as the percentage of files shared by that bandwidth class.
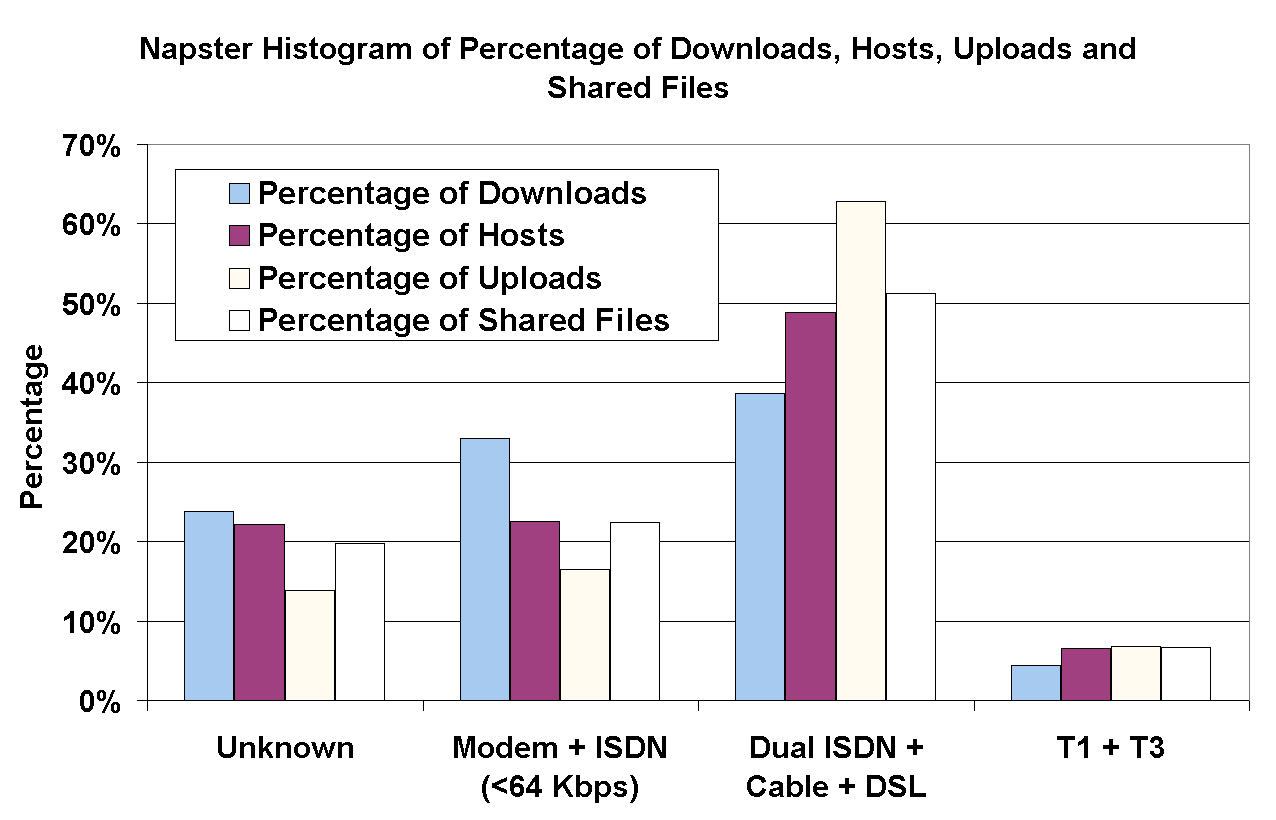
Figure 9: Percentage of downloads, peers, uploads and shared files, grouped by reported bandwidths (in Napster).
However, the relative number of downloads and uploads varies significantly across the bandwidth classes. For example, although 56Kbps modems constitute only 15% of the Napster peers, they account for 24% of the downloads. Similarly, cable modems constitute 32% of the peers, but they account for 46% of the uploads. The skew in the number of uploads is attributed by users selecting high-bandwidth peers from which to download content. The skew in the number of downloads, however, seems to be more representative of the natural tendency of low-bandwidth peers to be free-riders.
3.4 The Nature of Shared Files
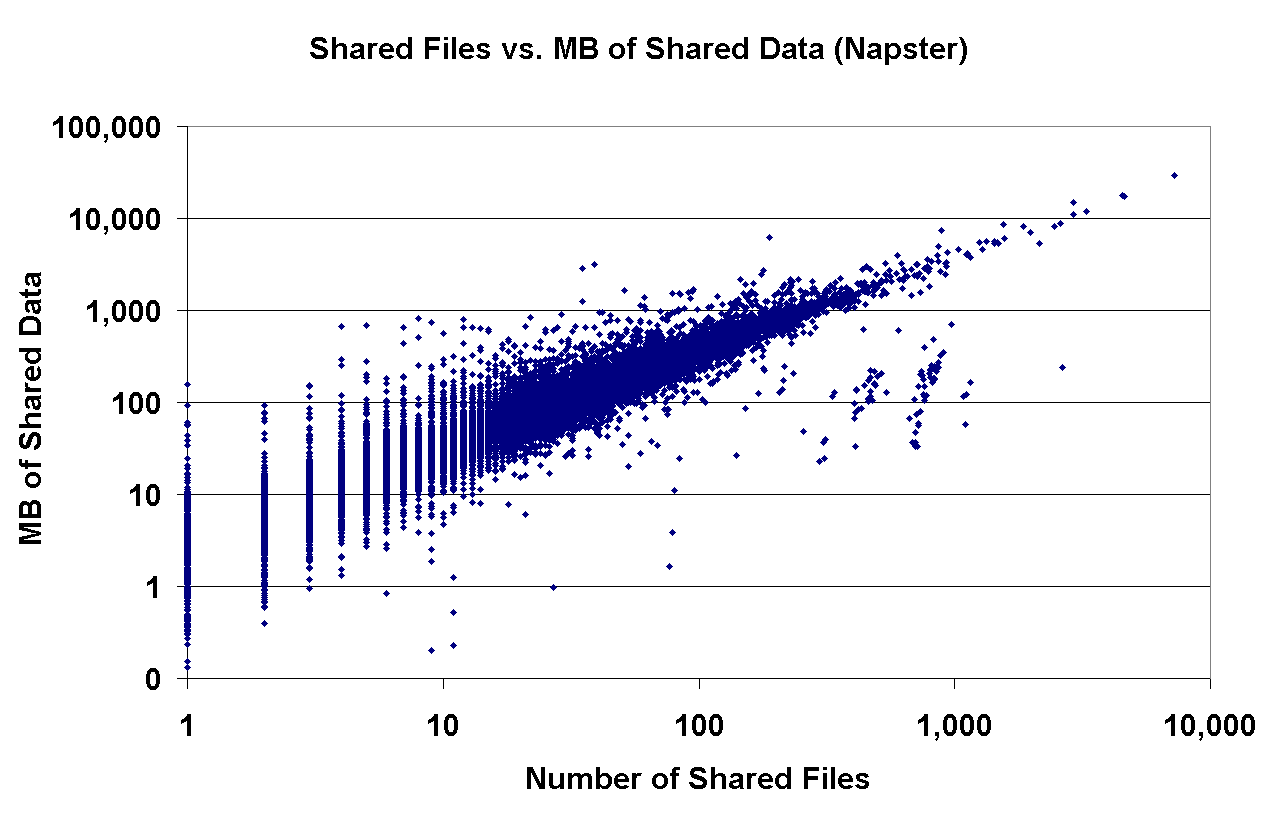
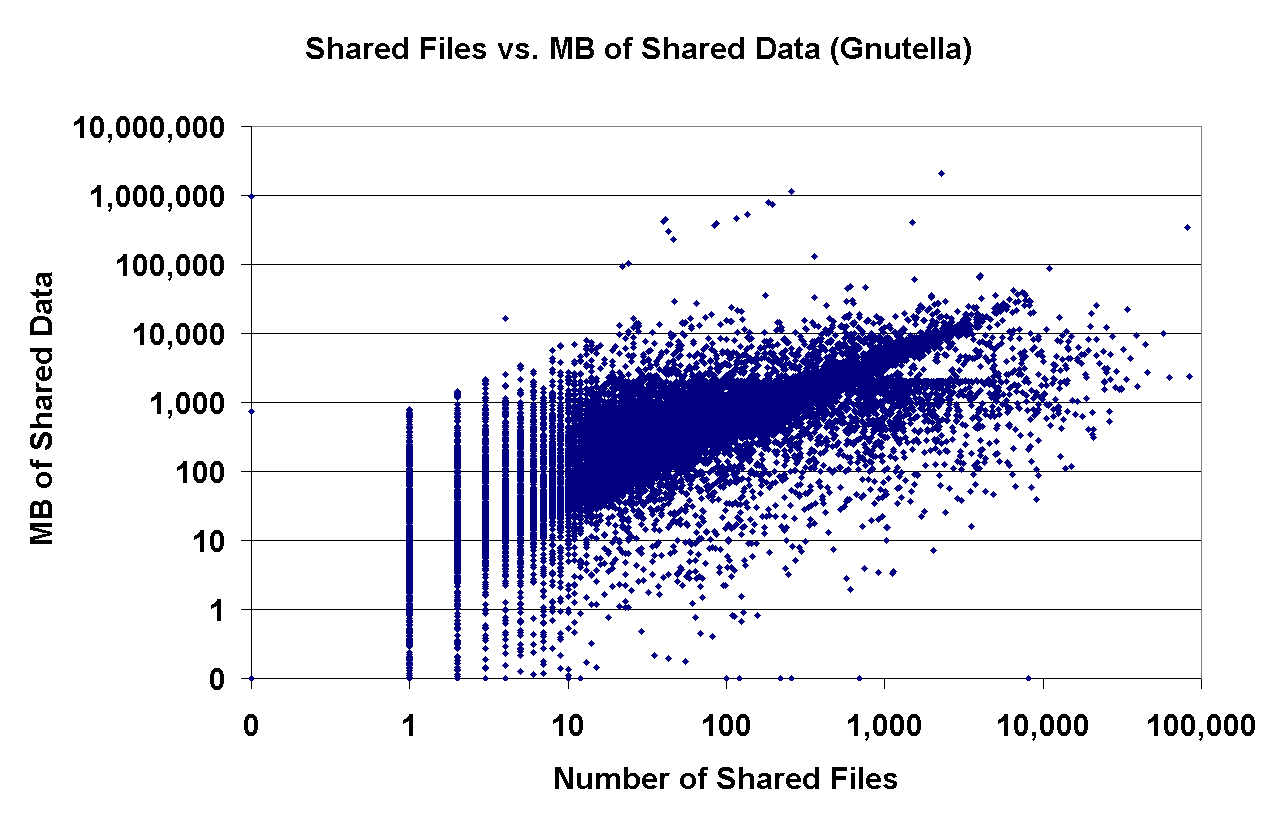
Another aspect of interest deals with the characteristics of the shared files in the two systems. In Napster, all shared files must be in MP3 format, whereas any file type can be exchanged in Gnutella. Each point in Figure 10 corresponds to the number of files and the number of MB a Napster and Gnutella peer reports as shared (plotted on a log-log scale). The obvious lines in both graphs imply that there is a strong correlation between the numbers of files shared and the number of shared MB of data. The slopes of the lines in both graphs are virtually identical at 3.7MB, corresponding to the size of a shared typical MP3 audio file. Another interesting point is the presence of a Gnutella peer that apparently shares 0 files but 730 MB of data; clearly a bug in the software or a case of malicious peers misreporting the amount of data they have to share.
|
|
|---|---|
Figure 10: Shared files vs. shared MB of data in Napster and Gnutella. | |
3.5 How Much Are Peers Willing to Cooperate in a P2P File-Sharing System?
The peer-to-peer model fundamentally depends on the concept of cooperation. How willing peers are to cooperate is of vital importance to the viability of these systems. Devising an experiment to quantify a peer's willingness to cooperate is of course very difficult; as a first-order approximation, we measured the extent to which peers deliberately misreport their bandwidths.
On the left, Figure 11 shows the distribution of measured bandwidths for Napster peers, classified by their reported bandwidth. Note that as high as 30% of the users that report their bandwidth as 64 Kbps or less actually have a significantly greater bandwidth. In Napster (and any similar system), a peer has an incentive to report a smaller bandwidth than the real value, in order to discourage others from initiating downloads and consuming the peer's available bandwidth. Similarly, we expect most users with high bandwidths to rarely misreport their actual bandwidths. Indeed, Figure 11 confirms that only than 10% of the users reporting high bandwidth (3Mbps or higher) in reality have significantly lower bandwidth.
|
|
|---|---|
Figure 11: Left: Measured downstream bottleneck bandwidths for peers, grouped by their reported bandwidths; Right: CDFs of measured downstream bottleneck bandwidths for those peers reporting unknown bandwidths along with all Napster users. | |
In addition to showing that many peers are uncooperative in Napster, this graph serves to validate the accuracy of our bottleneck bandwidth estimation technique. There is an extremely strong correlation between measured bandwidth and reported bandwidth, across all reported classes.
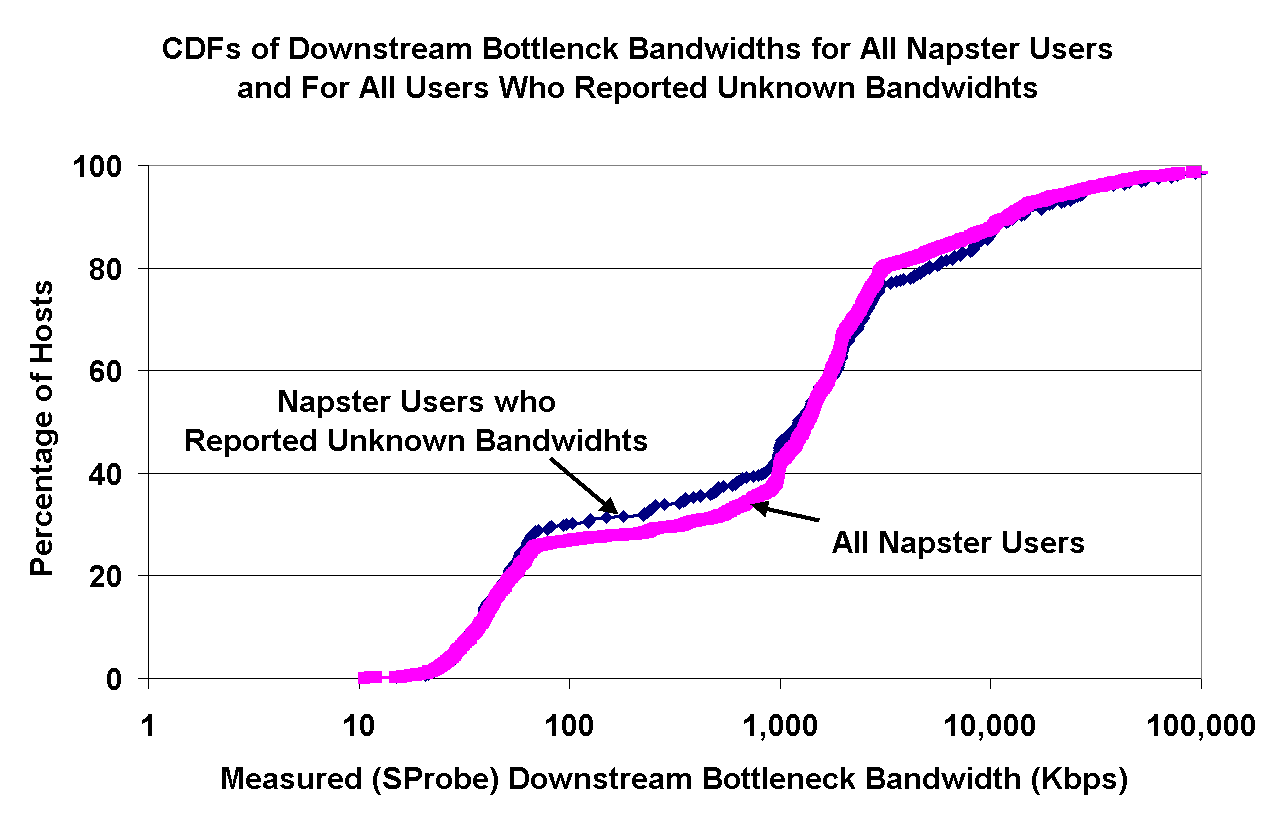
The right graph in Figure 11 shows the distribution of measured downstream bottleneck bandwidth of Napster peers reporting unknown bandwidths. Overlain on top of this distribution, we have shown the distribution of measured bandwidths of all Napster peers, regardless of their reported bandwidth. The similarity between the two curves implies that peers reporting unknown bandwidths are uniformly distributed across the population.
3.6 Resilience of the Gnutella Overlay in the Face of Attacks
In Gnutella, peers form an overlay network by each maintaining a number of point-to-point TCP connections, over which various protocol messages are routed. The Gnutella overlay presents a great opportunity to understand the challenges of creating effective overlay topologies. In particular, we were interested in the resilience of the Gnutella overlay in the face of failures or attacks.
In Gnutella, the fact that peers are connecting and disconnecting from the
network has implications about the nature of the overlay topology. In
practice, because peers tend to discover highly available and
high-outdegree nodes in the overlay, connections tend to be formed
preferentially. As Barabási and Albert show [17], vertex
connectivities in networks that continuously expand by the addition of new
vertices and in which nodes express preferential connectivity toward
high-degree nodes follow a power-law distribution. Indeed, previous studies
have confirmed the presence of a vertex connectivity power-law distribution
for the Gnutella overlay [8] with an index of
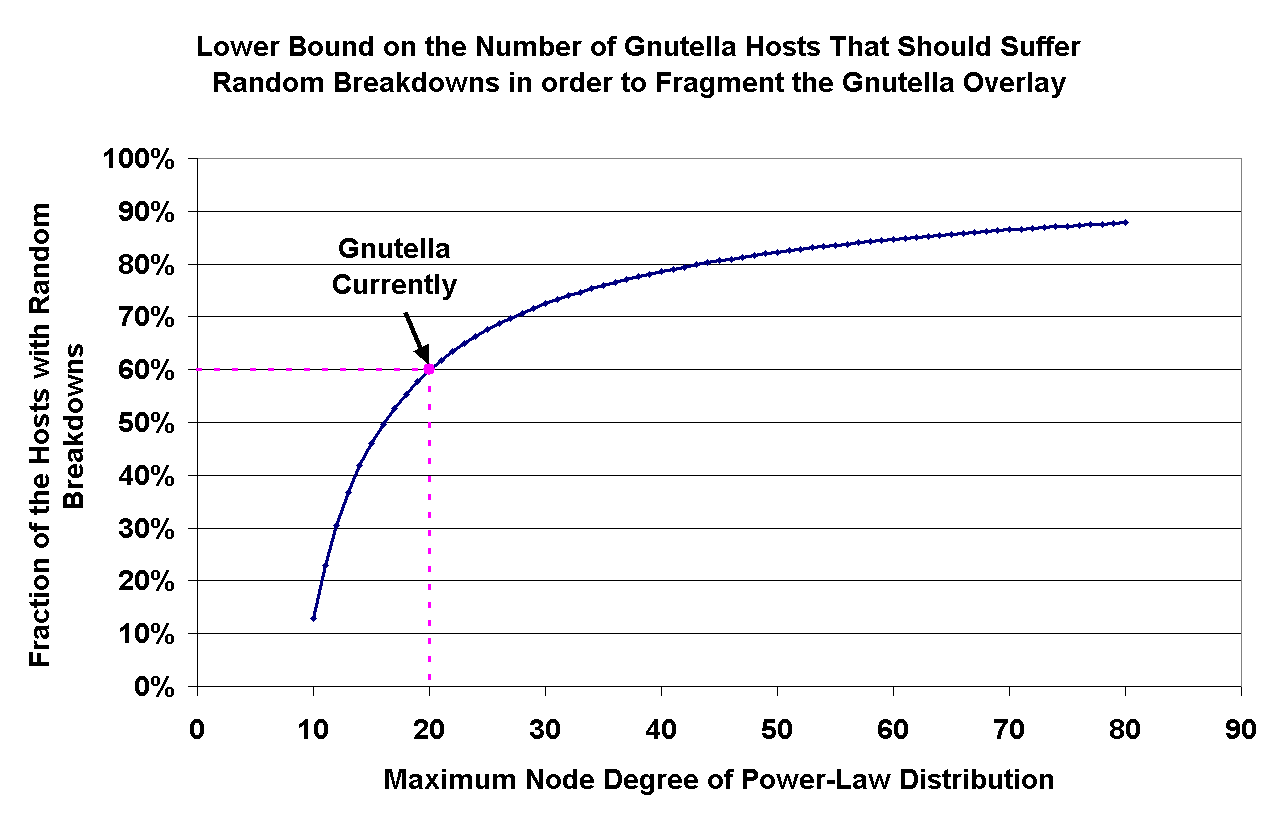
Cohen et. al [18] have analytically derived that networks in
which the vertex connectivity follows a power-law distribution with an
index of at most ( Figure 12: Lower bound on the number of Gnutella peers that must suffer
random breakdowns in order to fragment the Gnutella
network.
As this graph shows, Gnutella presents a highly robust overlay in the face
of random breakdowns; for a maximum node degree of 20 (which is
approximately what we observed in the real Gnutella overlay), the overlay
fragments only when more than 60% of the nodes shutdown. While overlay
robustness is a highly desirable property, the assumption of random
failures breaks down in the face of an orchestrated attack. A malicious
attack would perhaps be directed against the best connected, popular, high
degree nodes in the overlay.
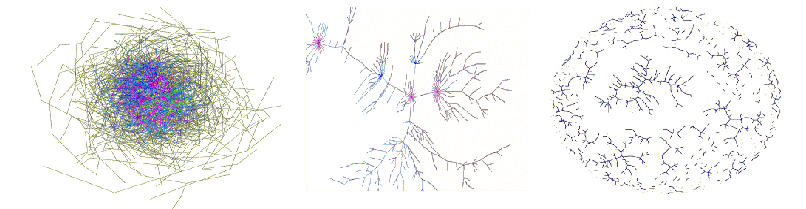
The left graph in Figure 13 depicts the topology of 1771 peers forming a
connected segment of the Gnutella network captured on February 16th, 2001.
The middle graph shows a portion of the topology after 30% of the nodes are
randomly removed. After this removal, the largest connected component in
the topology consists of 1106 of the remaining 1300 nodes. However, in the
right graph, we show the original topology after removing the 63 (less than
4%) best connected Gnutella peers. This removal has effectively
``shattered'' the overlay into a large number of disconnected components.
As we see, although highly resilient in the face of random breakdowns,
Gnutella is nevertheless highly vulnerable in the face of
well-orchestrated, targeted attacks.
Figure 13: Left: Topology of the Gnutella network as of February 16, 2001 (1771
peers); Middle: Topology of the Gnutella network after a random 30%
of the nodes are removed; Right: Topology of the Gnutella network
after the highest-degree 4% of the nodes are removed. 4. RECOMMENDATIONS TO PEER-TO-PEER SYSTEM DESIGNERS
There has been a flurry of proposed distributed algorithms for routing
and location in a P2P system. Most of these protocols and proposals
make the implicit assumption that the delegation of responsibility
across nodes the overlay should be uniform, and hence that all nodes
will tend to participate and contribute equally in information
exchange and routing. In contrast, our measurements indicate that the
set of hosts participating in the Napster and Gnutella systems is
heterogeneous with respect to many characteristics: Internet
connection speeds, latencies, lifetimes, shared data. In fact, the
magnitude of these characteristics vary between three and five orders
of magnitude across the peers! Therefore, P2P systems should delegate
different degrees of responsibility to different hosts, based on the
hosts' physical characteristics and the degree of trust or
reliability.
Another frequent implicit assumption in these systems is that peers tend to
be willing to cooperate. By definition, to participate in a P2P system, a
peer must obey the protocol associated with the system. In addition, most
users tend to download pre-created software clients to participate in these
systems (as opposed to authoring their own). These software packages
typically ask users to specify configuration parameters (such as Internet
connection speed) that will be reported to other peers. As we have shown,
many of these parameters are in practice either left unspecified or
deliberately misreported. Instead of relying on reported characteristics,
we believe that a robust system should attempt to directly measure the
characteristics of peers in the system.
Another myth in P2P file-sharing systems is that all peers behave equally,
both contributing resources and consuming them. Our measurements indicate
that this is not true: client-like and server-like behavior can clearly be
identified in the population. As we have shown, approximately 26% of
Gnutella users shared no data; these users are clearly participating to
download data and not to share. Similarly, in Napster we observed
that on average 60-80% of the users share 80-100% of the files, implying
that 20-40\% of users share little or no files.
The experiments and the data presented in this paper indicate that
many of the characteristics that Napster and Gnutella P2P systems in
practice match the characteristics of the classic server-client model.
Thus, we believe that future robust P2P protocols should account for
the hosts heterogeneity, relying on self-inspection and adaptation to
exploit the differences in the hosts' characteristics, behavior, and
incentives.
5. CONCLUSIONS
In this paper, we presented a measurement study performed over the
population of peers that choose to participate in the Gnutella and
Napster peer-to-peer file sharing systems. Our measurements captured
the bottleneck bandwidth, latency, availability, and file sharing
patterns of these peers.
Several lessons emerged from the results of our measurements. First, there
is a significant amount of heterogeneity in both Gnutella and Napster;
bandwidth, latency, availability, and the degree of sharing vary between
three and five orders of magnitude across the peers in the system. This
implies that any similar peer-to-peer system must be very deliberate and
careful about delegating responsibilities across peers. Second, even
though these systems were designed with a symmetry of responsibilities in
mind, there is clear evidence of client-like or server-like behavior in a
significant fraction of systems' populations. Third, peers tend to
deliberately misreport information if there is an incentive to do so.
Because effective delegation of responsibility depends on accurate
information, this implies that future systems must either have built-in
incentives for peers to tell the truth or systems must be able to directly
measure and verify reported information.
ACKNOWLEDGEMENTS
We would like to thank all of the people in the University of Washington
Computing and Communications services and the Department of Computer
Science and Engineering that patiently responded to the many email messages
arising from our bottleneck bandwidth measurement study. In particular, we
would like to thank Michael Hornung, Jan Sanislo, Erik Lundberg, and Ed
Lazowska for supporting our work. We would also like to thank Andy
Collins, Neil Spring and Andrew Whitaker for their helpful comments on this
research. This work was supported by NSF ITR grant 0121341, and gifts
from Intel Corporation and Nortel Networks.
REFERENCES![]() .
.
![]() ) are very robust in the face of random
node breakdowns. More concretely, in such networks, a connected
cluster of peers that spans the entire network survives even in the
presence of a large percentage p of random peer breakdowns, where
p can be as large as:
) are very robust in the face of random
node breakdowns. More concretely, in such networks, a connected
cluster of peers that spans the entire network survives even in the
presence of a large percentage p of random peer breakdowns, where
p can be as large as:
![]()
where m is the minimum node degree and $K$ is the maximum
node degree. For Gnutella, Figure 12 shows a graph of this equation as a
function of the maximum degree observed in the system, where the power-law
index ![]() was set to 2.3 and the minimum node degree m was set to
1.
was set to 2.3 and the minimum node degree m was set to
1.
http://www.clip2.com/.
http://www.3com.com/technology/tech_net/white_papers/pdf/50065901.pdf.